Parallax is a displacement or difference in the apparent position of an object viewed along two different lines of sight, and is measured by the angle or semi-angle of inclination between those two lines.
To measure large distances, such as the distance of a planet or a star from Earth, astronomers use the principle of parallax. Here, the term parallax is the semi-angle of inclination between two sight-lines to the star, as observed when Earth is on opposite sides of the Sun in its orbit.
Here's how the mesurements go:
As Earth revolves around the Sun, the direction in which we see a nearby star varies with respect to distant stars. We define the parallax of the nearby star to be one half of the total change in direction, and we usually measure it in arcseconds.
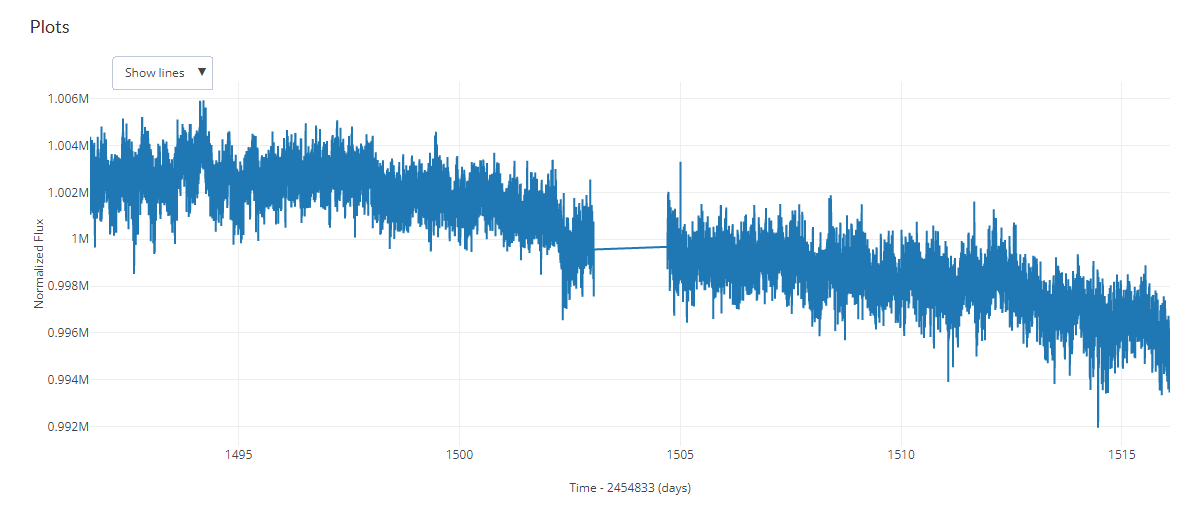
Let’s define some tools to help us keep track of how a star varies. A graph that shows how the brightness of a variable star changes with time is called a light curve (Figure 19.9). The maximum is the point of the light curve where the star has its greatest brightness; the minimum is the point where it is faintest. If the light variations repeat themselves periodically, the interval between the two maxima is called the period of the star.
This light curve shows how the brightness changes with time for a typical cepheid variable, with a period of about 6 days.
The importance of cepheid variables lies in the fact that their periods and average luminosities turn out to be directly related. The longer the period (the longer the star takes to vary), the greater the luminosity. This period-luminosity relation was a remarkable discovery, one for which astronomers still thank their lucky stars. The period of such a star is easy to measure: a good telescope and a good clock are all you need. Once you have the period, the relationship (which can be put into precise mathematical terms) will give you the luminosity of the star.

A light curve analysis it's used to generate graphs that show the brightness of an object over a period of time. With the data from this graph, you can find out the distance of an exoplanet, and with that, you are able to find the radius, and finally the mass.

The radius it's calculated with the next formula:

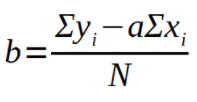
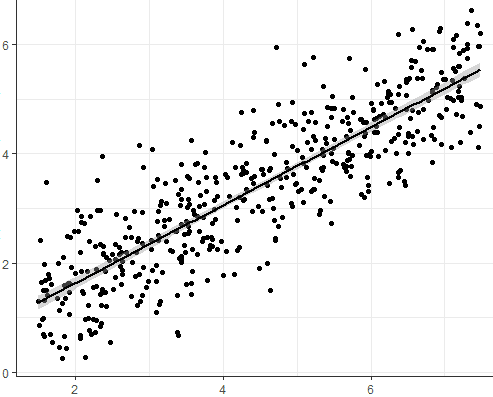
A linear regression line has an equation of the form Y = a + bX, where X is the explanatory variable and Y is the dependent variable. The slope of the line is b, and a is the intercept. For the exoplanets we use this system to find out the mass, while all the data points are the radius. This can be also used to find R (the distance from the points to the line generated). This is calculated with the following formulas:


This is an example of a Linear Regression graphic:

In a binary star system, we can find data related to the stars' brightness, and then make a graphic with that data. Comparing both stars we will be able to find out which one is brighter, and then found their distance and radius.
The exoplanet's timing variation of transit provide means of detecting additional planets in the system. The short-period and resonant variations of the transit signal are probably the most diagnostic of the perturbing planet's mass and orbit. The method can be sensitive to small perturbing masses near the transiting planet and for orbits at mean motion resonances.
It is the first technique used to reveal the existence of extrasolar planetary systems hosted by solar-type stars. Radial-velocity surveys led to the detection of a rich population of super-Earths and Neptune-type planets. Combining Doppler measurements with photometric observations of planets transiting their host stars further provides access to the planet bulk density, a first step towards comparative exoplanetology.