My colleagues and I started a research project which consists in recollecting pollution data from other Catalan cities in the last years and then, analyze it with some graphics to find if the city we got goes too many times above the limit in specific pollutants during the past years, months and days
-RStudio: This is the service we used to manage all the data recollected. RStudio is an application that has the purpose to manage big data with R, a programming language for statistical computing and graphics
-Libraries: To manage the data, we used different libraries as Openair, lares, ggplot, Tidyverse. Openair it’s the most used one, it gives a lot of different ways to analyze air pollution data and obtain graphics from it, lares is an auxiliary package for better/faster analytics, visualization, data mining, and machine learning tasks, tidyverse is used to reorganize some tables as we like to have them and ggplot has te possibility to create our own graphics
-Code used: We used lots of codes from an archive we got in a google colab and from a web, both found in references
-XEMA Meteorological Web: Here is where we got all the big amounts of data of our cities
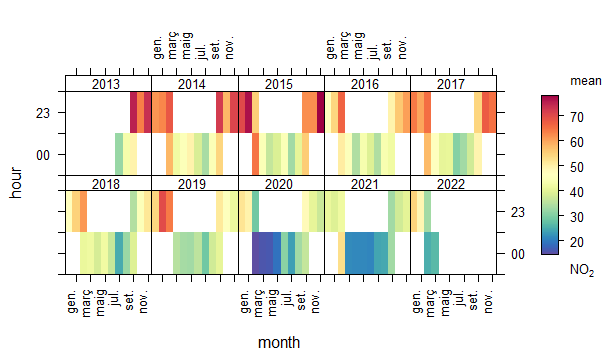
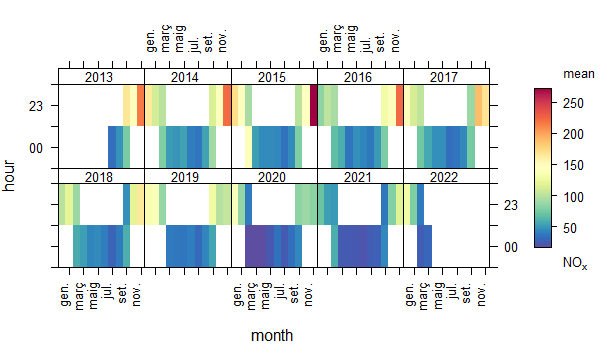
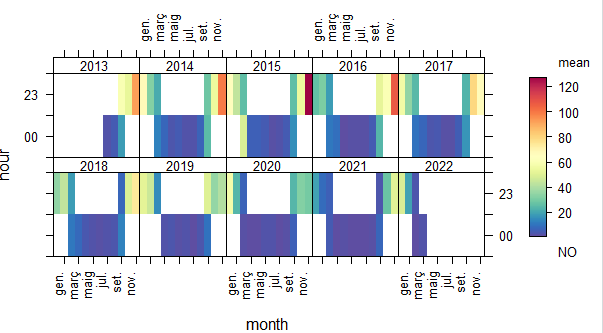
This three graphs gives us a monthly report in times of the day of every year's pollution of specific pollutnats, in our case NOx (as the highest one), NO2 and NO
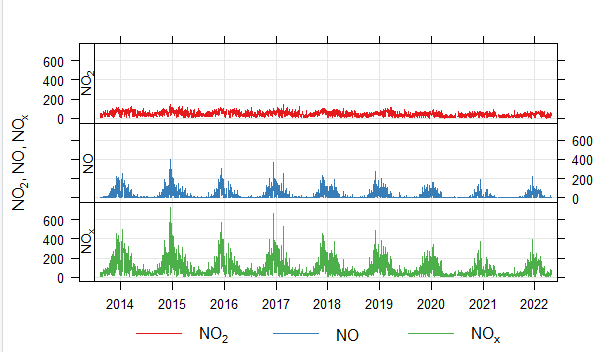
Here we can see a yearly graph that indicates us for each pollutant which one increased or decreased and when, showing the quantity of it. We can clearly see that NOx it's the highest one and actually didn't decreased too much, meanwhile NO it's a bit lower but still hasn't changed too much, but NO2 has practically been low compared to the other two and didn't change at all
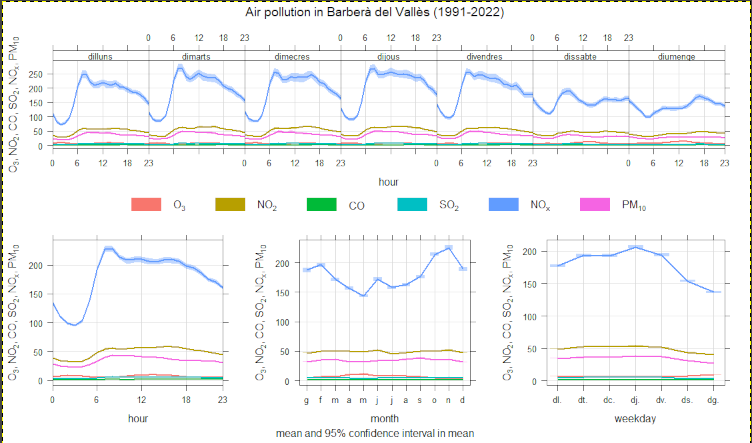
Here we can see daily, weekly and mothly graphs of the quantity of many different pollutants. As we said latter and it's here again, the NOx it's always the highest compared to the rest, although here we can see maybe a small decrease within the time. NO2 it's the second one highest, although it doesn't change too much, it's also important as it's limit it's lower and we cannot exceed too much with it
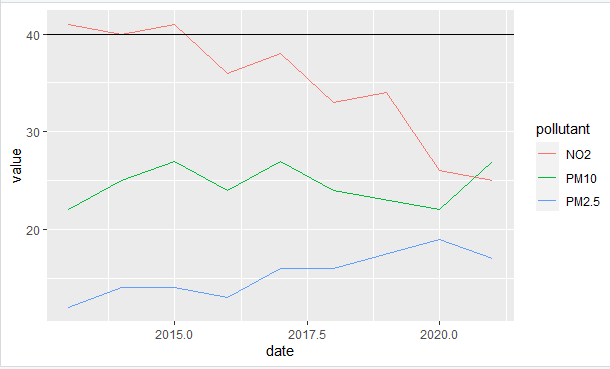
Now I made this graph with the data from some years that indicates the quantity of NO2, PM10 and PM2.5 found in the city. As we can see, the most relevant one that surpases the limit (40) it's NO2, which could be dangerous, but luckily with the pass of the years it went down until it became safe. PM10 and PM2.5 hasn't had any heavy increase or decrease in the past years
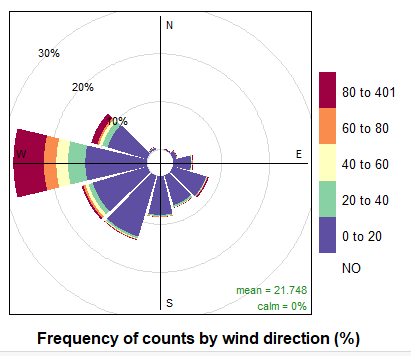
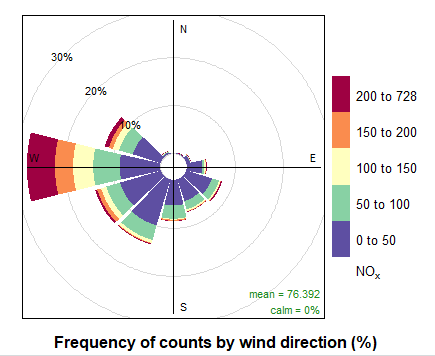
This graphs are Pollution Roses, which indicate quanitites of pollutants indicating the direction of the wind. Again, we find out that NO is the lowest, NO2 the 2nd and NOx the one with most value, but here we see that NOx it's mostly present in the direction of the wind, when NO2 it's mostly spread out rather that just in one spot
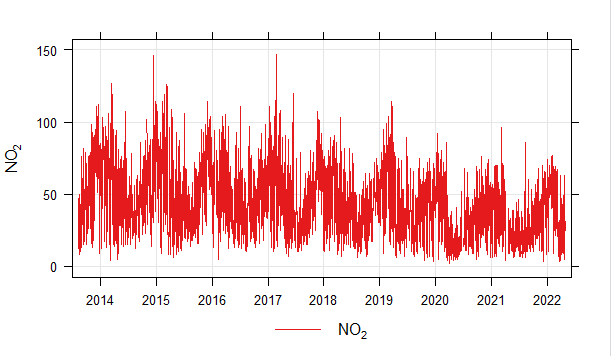
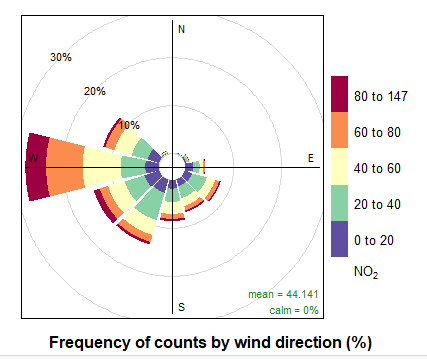
This is a yearly graph only of the NO2, here we can see how the NO2 actually surrpases the EU limit, which is 40, and a lot of times
The conclusions I managed to get from all the graphs it’s that, in Barbera del Valles, NO2 and NOX sometimes surpasses the recommended safety limits:
As we can see in the yearly graph, the NO2 production hasn’t massively changed, but it actually decreased a bit since 2014. NOx and NO still looks similar as in 2014 but maybe slightly decreased
In other graphs NOx is also shown as surpassing the averages and the NO2 passing over some average limits, which can be quite dangerous
R Studio: https://www.rstudio.com/products/rstudio/download/
-XEMA Meteorological Data: https://analisi.transparenciacatalunya.cat/Medi-Ambient/Dades-meteorol-giques-de-la-XEMA/
-All code used: https://colab.research.google.com/drive/1CO91fiUEVcZqOGW_g59pcRoVd6wjH6hO?usp=sharing & https://blocs.xtec.cat/tecno/science/environment/
-Library Openair: https://www.openairlib.net/
-More detailed information about everything here: https://alexsanfeliu.neocities.org/BarberaDelVallesPollution/index.html